


Melanoma Computer-Aided Diagnostics
About Project
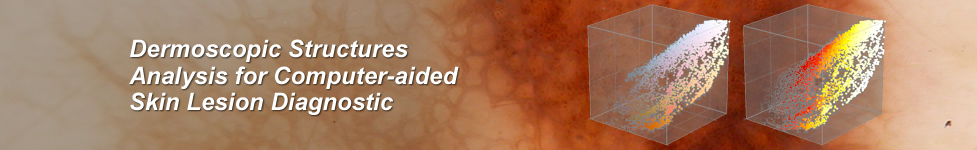
Main objective of the research is to define description taxonomy for textures present on dermoscopic images of skin lesions and creation of image processing methods that will allow recognition of those methods.
Textures recognized by using those methods will serve as features for the feature vector describing every lesion image. Feature vector is later used in process of image classification (aided diagnostic).
Book publication
 Following information have been published in the book:
Melanoma in the Clinic - Diagnosis, Management and Complications of Malignancy,
ISBN: 978-953-307-571-6
Modern Techniques for Computer-Aided Melanoma Diagnosis
By Maciej Ogorzałek,
Leszek Nowak,
Grzegorz Surówka
and Ana Alekseenko
PUBLICATION METRICS AND HISTORY
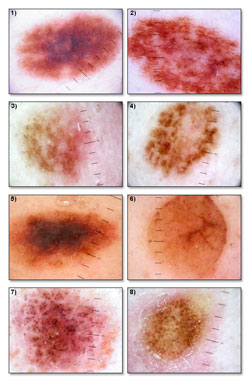
Clinical diagnostic approaches for diagnosis of melanoma
TDS score based on ABCD rule
TDS (Total Dermoscopy Score) – is a uniform system used for dermatoscopy assessment. Using a linear equation the ABCD rule (Nachbar et al. 1994) introduced the option to grade skin lesion depending on the degree of their malignancy. This degree is determined by the TDS value calculated from the following equation:
TDS = A*1.3 + B*0.1 + C*0.5 + D*0.5 (1)
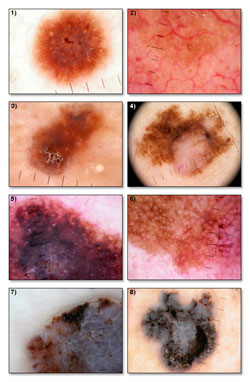
The ABCD (Asymmetry, Border, Color, Dermoscopic structures) rule is used for diagnosis of skin changes of melanocytic origin. It is used to assess lesion and brings an answer to the question whether it is a mild change, suspicious or malignant. The variables for the equation (1) are determined by visual assessment of: A - lesion shape asymmetry and color asymmetry, B – border shape and sharpness, C – presence of various colors (red, blue-gray, brown, black, white), D – presence of dermoscopic structures such as pigmented network, regression structures, dots, globules and so on.
Image acquisition process and image pre-processing
While working with digital images of any kind, the image acquisition is always the first step of image analysis process. Image acquisition is a stage, at which images are collected in order to create certain data set, which is later analyzed to see if any of the gathered images share similar features or contain any of the predefined features, or meet previously defined assumption.
Image acquisition
Dermoscopic images are basically digital photographs/images of magnified skin lesion, taken with conventional camera equipped with special lens extension. The lens attached to the dermatoscope acts like a microscope magnifier with its own light source that illuminates the skin surface evenly. There are various types of dermoscopy equipment, but all of them use the same principle and allow registering skin images with x10 magnification and above. Due to light source integrated into dermatoscope lens, there happens to be problem with skin reflections. To counteract this problem, a liquid is used as a medium layer between the lens and the skin. In modern dermatoscope the liquid is not necessary, because of the polarized light source that removes the reflection problem.
Digital images acquired using photo dermatoscope are sufficiently high resolution to allow for precise analysis in terms of differential structures appearance. Dermatologist can create accurate documentation of gathered images, opening a path for computer analysis, where images are processed in order to extract information that can later be used to classify those images.
Image preprocessing
Before analysis of any image set can take place, pre-processing should be performed on all the images. This process is applied in order to make sure that all the images are consistent in desired characteristic. When working with dermatoscopic images, pre-processing can cover number of features like: image illumination equalization, color range normalization, image scale fitting, or image resolution normalization. This can be dependent on defined prerequisites and methods applied in post processing.
An example of elementary operation such as image normalization is the resolution matching. Assuming that the image size in pixels is given, and all images are in the same proportion (e.g. aspect ratio of 4:3), it is easy to find the images of smallest resolution and then scale the larger images to match the size of the smallest one. This operation allows calculating the features like lesion dimensions, lesion border length and lesions area coverage. It is possible to normalize the other parameters like color palette normalization, color saturation normalization, normalization of color components, and so on. Very common operation in preprocessing is color components normalization, known as the histogram equalization.
Image histogram is the distribution of colors values in between extreme colors used in the palette. Assuming the situation where the brightest points of the grayscale image are not white and the darkest points are not black, performing histogram equalization will redistribute all the colors of the image in a way that brightest spot of the processed image will be color and the darkest regions of the image will become black. Figure 2 illustrates the results of histogram equalization performed on a dermoscopic image.
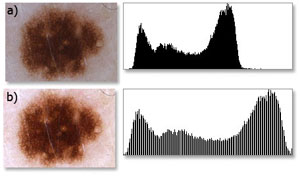
Fig. 2. a) original image and its corresponding histogram, b) image after histogram equalization and its corresponding histogram.
Normalized image is characterized by better brightness, sharpness and color depth, thereby allowing easier separation the lesion area from the background (skin color). Applying histogram equalization operation allows for better differentiation of image detail, and thus improves the efficiency of features extraction. Histogram equalization can be performed for each of the color components separately, or on all of the components at once.
Filters
Filtering an image consists of application of a certain transformation or an algorithm to image data in order to modify certain part of it. The most common task of a filter is to separate redundant information from the relevant data. By using simple filters it is possible to sharpen image, blur image, change color, etc. Applying more complex filters is possible to enhance more important sections of the image. An example for this can be strengthening particles or detection edges.
In image processing one certain transformation is most notable, namely the binarization. It is a point transformation that is one of the basic operations used when processing any image. This operation based on gray-scale image and given threshold value will outputs a binary image, which uses only two colors (black and white) to represent data. To achieve the binary image a threshold needs to be defined. This threshold is used to determine which points of the original image will be converted to black and which to white. The binarization process is illustrated by figure 3. Having a binary image allows performing various operations like measuring the length, performing segmentation, determining the number of elements, etc. Binary image is easy to work with, as most operations are fast to perform and do not require long computing time. It is quite easy to analyze the shape of objects, calculate symmetry, or find the center of weight of an object.
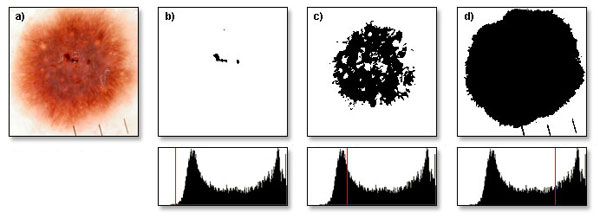
Fig. 3. a) original image, b) binarized image using threshold value of 60, c) binarized image using threshold value of 100, d) binarized image using threshold value of 200.
A simple example illustrating the idea of using filters in dermoscopic images can be the removal of artifacts such as hair (figure 4). To do this, a maximum filter can be applied on a binary image. Maximum filter process each point of an image and calculate its surrounding (neighborhood) in determined distance, then the maximum value is entered in the output image. As a result, the small details of the image are removed depending on the neighborhood size. The use of this filter on the single object will reduce it in size.
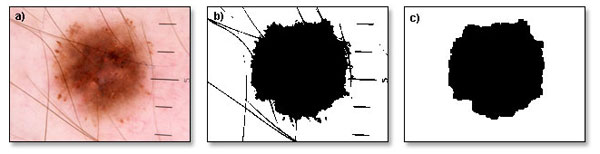
Fig. 4. Hair removal. a) original image, b) binarized image, c) image with removed artifacts.
Performing binarization on dermoscopic image can sometimes create errors in output, may it be due to poor illumination of the corners, or hairs on the image. Dealing with unevenly illuminated image is another practical example of filtering unwanted data from dermoscopic image. For this purpose a specific algorithm is used and results of its application can be viewed in figure 5. This algorithm's task is to check whether there is an object in the middle of the image, and then whether each of the corners of the image contains different object in contact with the edges of the image. If it happens that all image corners contain objects then they are removed. Condition for the proper removal of redundant objects is that on the image, there must be at least two different objects, and each of the points in the corners must be a part of one of the objects. If all conditions are met, the filter removes all points belonging to object in contact with the corners of the image. This filter can only work with images that cover entire lesion. If image contains only a fragment of the lesion, this filter will not modify the input image.
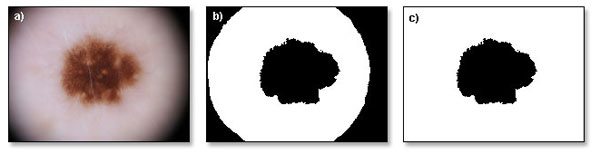
Fig. 5. Filtering of vigneting artefacts. a) original image, b) binarized image, c) image with filtered corners.
Numerical methods for image analysis
Several types of image analysis can be done in an automatic way. Specifically geometric features and color features/decompositions can be easily performed and are found in many commercial image analysis and dermoscope accompanying programs.
Geometric features
Many attempts have been made to automate the process of dermoscopic image feature extraction, and a number of algorithms have been developed to do this. Most common geometric features that are calculated are lesion dimensions, borders shape, lesion symmetry and color symmetry lesion area. More complex problem like various differential structures recognition still exist and is a subject of current image processing research.
Calculation the dimensions of lesion on the dermoscopic image is an easy task. The easiest way to determine the surface size is to count all points that are marked as the lesion on the binary image achieved in process of binarization. The sum of these points and its percentage cover of an image lesion image can be used as variables in classification process. These two factors can be used to calculate other factors like various color coverage of the lesion.
Border length of the lesion is another feature that is easily calculated from a binary mask of the dermoscopic lesion image. Border length can be calculates simply by counting all boundary points on binary lesion mask. It is possible to estimate how irregular the border is by comparing it to the lesion size, e.g. circular lesion would have shorter border length comparing to irregular lesion of the same size.
The symmetry of the lesion is an important factor in diagnostic process. Calculating symmetry value as a geometrical feature requires more complex operations, as it is necessary to estimate proper axis of symmetry. This task can proved to be complicated, even with the manual axis alignment. The examples images for determining the symmetry axis are illustrated in figure 6.
Using the algorithm of smallest bounding box estimation prove to be effective way to determine the symmetry axis for various lesion shapes. Symmetry axis for calculated bounding rectangle is used as the symmetry axis for the lesion. As shown on the figure 7.
Calculating the value of the symmetry is very simple and is done by checking if every point of the lesion on one side of the symmetry axis has its corresponding point on the other side of this axis. Symmetry is calculated separately for vertical and horizontal axis, and then the average value is subtracted from the lesion size value. The percentage of asymmetry can be calculated from this data and later used in the classification process.
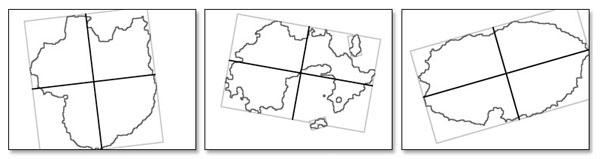
Fig. 7. Different lesion shapes and its corresponding bounding boxes and estimated symmetry axis.


Project related publications
- Leszek A. Nowak, Marcin P. Pawłowski, Maciej J. Ogorzałek (2012), Texture Analysis for Dermoscopic Image Processing, Biomedical Circuits and Systems Conference (BioCAS), pp. 292 – 295, ISBN: 978-1-4673-2291-1
- Leszek A. Nowak, Marcin P. Pawłowski, Maciej J. Ogorzałek (2012), Pigmented Network Structure Detection Using Semi-Smart Adaptive Filters, 2012 IEEE International Conference on Systems Biology (ISB 2012), pp. 310 – 314, ISBN 978-1-4673-4398-5
- Leszek A. Nowak, Marcin P. Pawłowski, Maciej J. Ogorzałek (2012), Dermoscopic Pattern Detection Using Swarm Intelligence Algorithm for Computer Aided Skin Lesion Diagnostics, Association of Asia-Pacific Operational Research Societies (APORS 2012)
- K. Przystalski, L. Nowak, M. Ogorzalek, G. Surowka (2012). Applications of Neural Networks in Semantic Analysis of Skin Cancer Images, Human – Computer Systems Interaction: Backgrounds and Applications 2 Series, Advances in Intelligent and Soft Computing, Vol. 99, pp. 111-124, Hippe, Zdzisław S.; Kulikowski, Juliusz L.; Mroczek, Teresa (Eds.), ISBN 978-3-642-23171-1
- 6.M.J. Ogorzałek, L. Nowak, G. Surówka, A. Alekseenko (2011). Modern Techniques for Computer-Aided Melanoma Diagnosis, Melanoma in the Clinic - Diagnosis, Management and Complications of Malignancy, Prof. Mandi Murph (Ed.), ISBN: 978-953-307-571-6, InTech, Available from: http://www.intechopen.com/articles/show/title/modern-techniques-for-computer-aided-melanoma-diagnosis
- K. Przystalski, M. Popik, M.J. Ogorzałek, L. Nowak (2011). Improved Melanoma Diagnosis Support System Based on Fractal Analysis of Images, ISORA 2011 August 28-31, 2011,Dunhuang, China, ORSC & APORC, pp. 203–210
- W. Piatkowska, J. Martyna, L. Nowak, K. Przystalski (2011). A Decision Support System Based on the Semantic Analysis of Melanoma Images Using Multi-elitist PSO and SVM, MLDM 2011, Lecture Notes in Computer Science, pp. 362-374
- K. Przystalski, L. Nowak, M.J. Ogorzałek, G. Surówka (2010). Semantic Analysis of Skin Lesions Using Radial Basis Function Neural Networks, Human System Interactions, pp. 128 – 132, ISBN: 978-1-4244-7560-5
- K. Przystalski, L. Nowak, M. Ogorzałek, G. Surówka (2010). Decision Support System for Skin Cancer Diagnosis, ISORA 2010, Lecture Notes in Operations Research 12, pp. 406–413, ISBN: 978-7-5100-2406-1/O819, APORC, Word Publishing Corporation
- W. Piątkowska, J. Martyna, L. Nowak, K. Przystalski (2010). A Decision Support System Based on Semantic Analysis of Melanoma Images Using SVM, MICAI 2010
- M.J. Ogorzałek, G. Surówka, L. Nowak, C. Merkwirth (2009). Computational Intelligence and Image Processing Methods for Applications in Skin Cancer Diagnosis, Biomedical Engineering Systems and Technologies, Communications in Computer and Information Science, Vol. 52, pp. 3-20, ISBN: 978-3-642-11720-6, Springer-Verlag
- M.J. Ogorzałek, G. Surówka, L. Nowak, C. Merkwirth (2009). New Approaches for Computer-Assisted Skin Cancer Diagnosis, Optimization and System Biology, Lecture Notes In Operation Research, vol. 11, pp. 65–72, ISBN: 978-7-5100-0549-7/O764, APORC, Word Publishing Corporation